Statistics IO is a command we can use to display statistical information from all executed SQL Server T-SQL statements. We can turn it on for our session using the command SET STATISTICS IO ON and turn it back off with the command SET STATISTICS IO OFF.
Statistics IO can be used to help performance tune queries. One of the ways a query can be improved is by minimising the amount data read by that query. Statistics IO allows us to benchmark this and create a baseline value. Baselining a query by the amount of data it is reading rather than other metrics such as how long it takes to run has some advantages. A queries run time can vary depending on what else is happening on the server. A server may be running at 100% capacity of 10% capacity which can effect a queries run time. The number of reads however, will stay consistent in either events.
Let’s run a query using the StackOverFlow2010 (freely available) database with Statistics IO enabled. We will query a number of tables; Users, Comments and Posts.
USE StackOverflow2010
GO


SET STATISTICS IO ON;


SELECT

	u.Id,
	u.LastAccessDate,
	u.Reputation,

	c.TotalScore AS TotalCommentScore,
	c.CommentNumber AS TotalCommentNumber,

	p.PostNumber AS TotalPosts,
	p.TotalViewCount AS TotalPostViews

FROM

	dbo.Users u

	LEFT JOIN (

		SELECT

			UserId, SUM(Score) AS TotalScore, COUNT(*) AS CommentNumber

		FROM

			dbo.Comments

		GROUP BY

			UserId


	) c ON u.Id = c.UserId

	LEFT JOIN (

		SELECT

			OwnerUserId, COUNT(*) AS PostNumber, SUM(ViewCount) AS TotalViewCount

		FROM

			dbo.Posts

		GROUP BY

			OwnerUserId

	) p ON u.Id = p.OwnerUserId;
The output of the command shows within the Messages output tab for SSMS. Part of the extract can be seen below.

For each table we queried we have a corresponding line with statistical information. We also have a line for a Worktable; this is an internal object built in tempdb which will perform any additional operations SQL needs. It will be dropped once the query is finished. Another table called a Workfile may also show up which also related to internal workings in tempdb.
The attributes shown for each row are described as follows:
- Table – the name of the table the statistics relates to.
- Scan count – number of seeks or scans run against the table.
- Logical reads – number of pages read from the data cache.
- Physical reads – number of pages read from disk and placed in the data cache.
- Read-ahead reads – number of pages placed into the cache for the query.
- Lob logical reads – number of pages read from the data cache for large off row objects such as varchar(max) and nvarchar(max).
- Lob physical Reads – number of pages read from disk for large objects.
- Lob read-ahead reads – number of pages placed into the cache for the query for large objects.
In general when I am analysing the numbers I am interested in the logical read numbers as this is telling us the number of pages read from the data cache where SQL does all its work.
What’s a page?
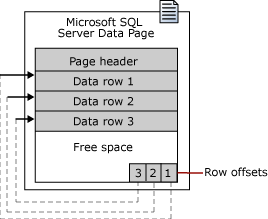
The attributes all relate to statistics for pages. A page is the smallest unit of data storage in SQL Server. SQL Server stores all it’s data on pages such as a table or an index. Pages are all the same size – 8 kilobytes but come in different flavours; data pages for storing user data and system pages for meta data. Pages come in a specified format.

- Page Header – 96-byte header that is used to store system information about the page such as page type, amount of free space on the page.
- Data row – where user data is stored.
- Free Space – where more data can be added to the page.
- Row offsets – records byte position of data rows. This helps SQL Server locate rows within the page quickly.
Readability
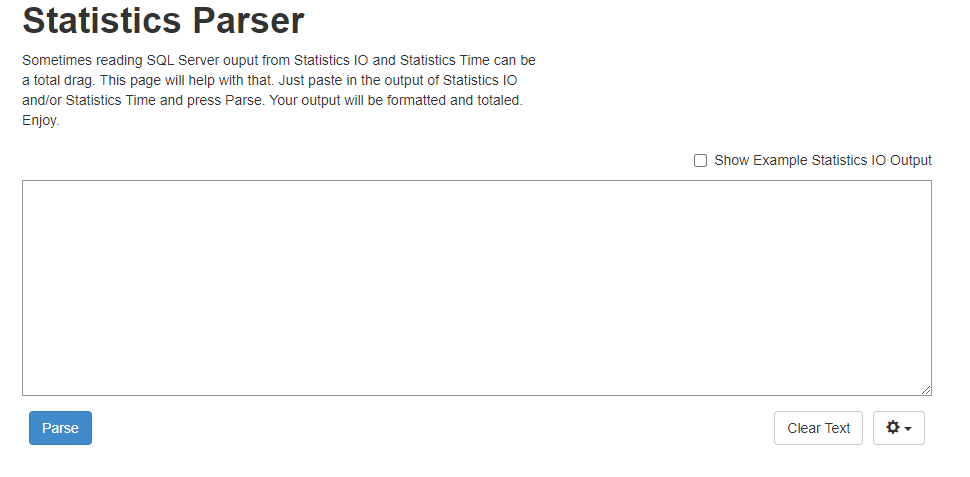
Reading Statistic IO outputs from SSMS can be cumbersome. Fortunately there is a handy tool on the internet which will transform the output into a more readable format called Statistics Parser. This can be found at https://statisticsparser.com/.

We will copy and paste the output from SSMS for our query into the above box. By pressing the parse button and you will get the below.

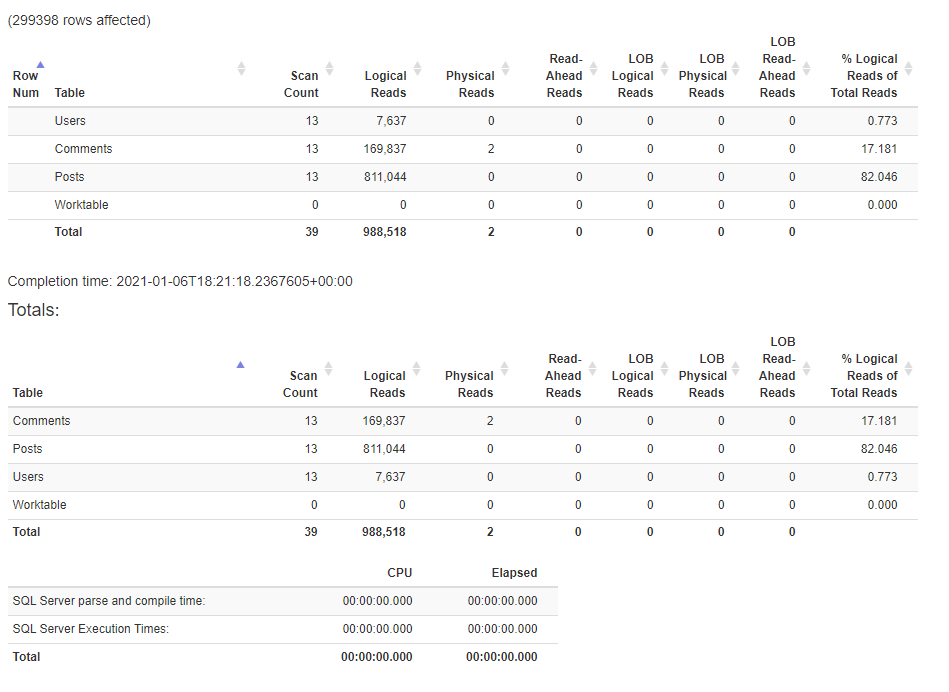
From the output we can easily see:
- The Comments table read 169, 837 8kb pages.
- The Posts table read 811, 044 8kb pages.
- The Users table read 7, 637 8kb pages.
Query Tuning
There are a lot of reads happening on both the Comments and Posts table. Both of these tables are part of subqueries which are summing up data and grouping by the userid. Let’s add a couple of covering indexes to each table. These indexes will order the data by the userid and include the columns we are aggregating up.
CREATE NONCLUSTERED INDEX ix_comment_userid ON dbo.Comments (userid) include(score);
CREATE NONCLUSTERED INDEX ix_post_userid ON dbo.Posts (OwnerUserId) INCLUDE (ViewCount);
We can run the exact same queries and extract the output from Statistics IO.
SET STATISTICS IO ON;


SELECT

	u.Id,
	u.LastAccessDate,
	u.Reputation,

	c.TotalScore AS TotalCommentScore,
	c.CommentNumber AS TotalCommentNumber,

	p.PostNumber AS TotalPosts,
	p.TotalViewCount AS TotalPostViews

FROM

	dbo.Users u

	LEFT JOIN (

		SELECT

			UserId, SUM(Score) AS TotalScore, COUNT(*) AS CommentNumber

		FROM

			dbo.Comments

		GROUP BY

			UserId


	) c ON u.Id = c.UserId

	LEFT JOIN (

		SELECT

			OwnerUserId, COUNT(*) AS PostNumber, SUM(ViewCount) AS TotalViewCount

		FROM

			dbo.Posts

		GROUP BY

			OwnerUserId

	) p ON u.Id = p.OwnerUserId;

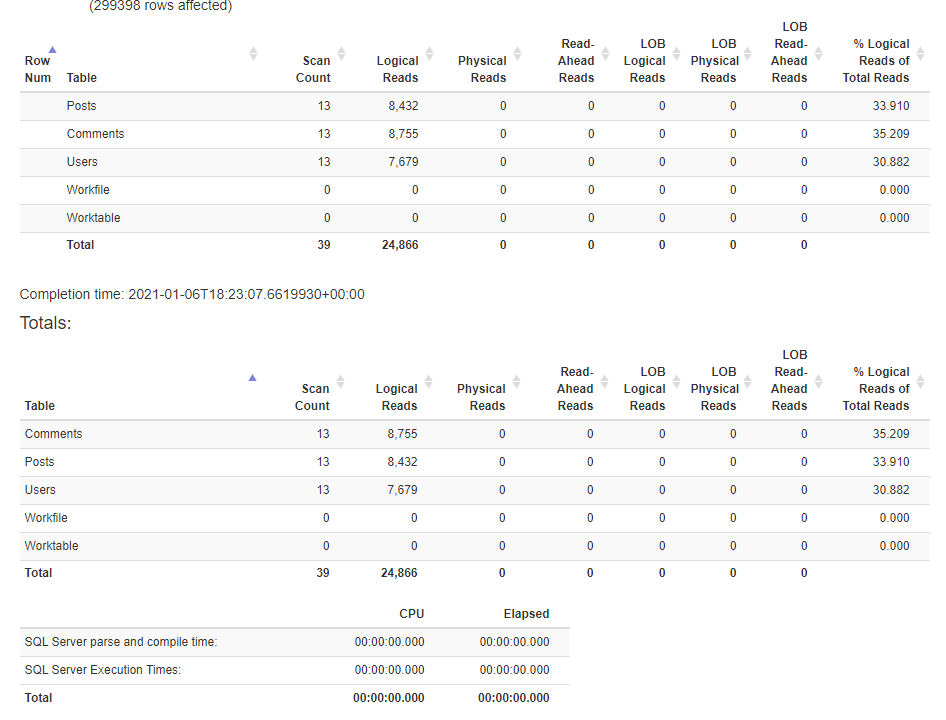
We now have the following output:
- The Comments table has read 8, 755 8kb pages, a decrease of 95% from the first execution.
- The Posts table has read 8,432 8kb pages, a decrease of 99% from the first execution.
- The Users table has read 7, 679 8kb pages which is ~ the same as the first execution.
The query is now making use of our covering indexes. Since the indexes contain less data we can fit more of the records onto each 8Kbpage and thus read a lot less of them!
Query Tuning Toolkit
Statistics IO is great tool for baselining queries for pages reads and a starting place for optimising queries. Remember that it is just part of a much wider toolkit for query tuning. There are many other tools at your disposal such as indexes or execution plans which can aid this exercise. However if a query is reading less data it is likely to perform better!