Microsoft recently released a brand new feature for public preview called Field Parameters. Field parameters allows users to dynamically change what is being shown within a visualisation. This feature allows a user to easily switch between the analysis of multiple metrics or multiple categorical breakdowns using a very small number of visualisations. Before this feature similar functionality could be done with a mixture of either calculation groups or bookmarks. Field parameters significantly simplifies these types of implementations and is quite a game change for Power BI report design and development.
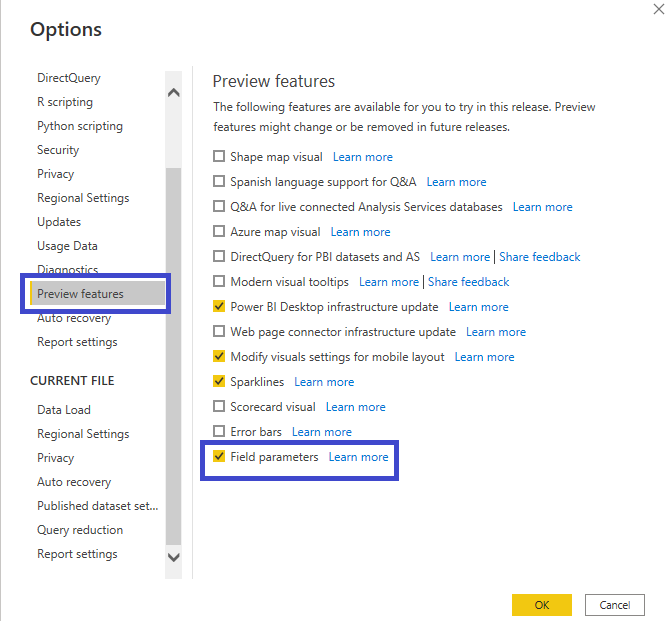
As of the writing of this blog fields parameter is in public preview and must be turned on within Power BI Desktop. Within Power BI Desktop navigate to File -> Options and settings -> Options and turn on Field Parameters. Power BI Desktop will likely need to restart for the settings to change.
Creating a field parameter
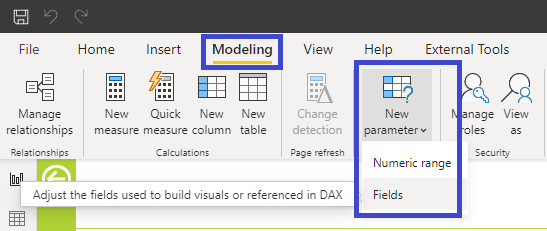
To create a new field parameter navigate to the Modelling tab and select New parameters -> Fields.
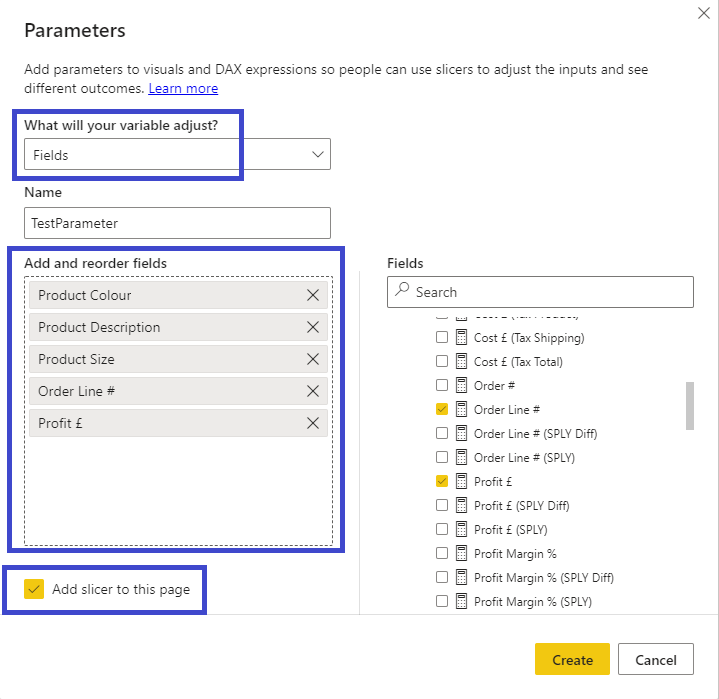
This will bring up the parameters wizard. Ensure the top box is set to Fields, give the parameter a name and drag and drop the fields you want in the parameter using the search function on the right hand side. You have the option to bring over dimensional attributes, measures, or a mixture of both. You also have the option to add a slicer for the field parameter to the page you are on automatically.
Once you press Create the following DAX code will be automatically generated. The field generate from this DAX is used to drive the field parameter slicer automatically generated on the page.
TestParameter = {
    ("Product Colour", NAMEOF('Product'[Product Colour]), 0),
    ("Product Description", NAMEOF('Product'[Product Description]), 1),
    ("Product Size", NAMEOF('Product'[Product Size]), 2),
    ("Order Line #", NAMEOF('Sale'[Order Line #]), 3),
    ("Profit £", NAMEOF('Sale'[Profit £]), 4)
}
NAMEOF is a new DAX function introduced for field parameters and returns the name of the column or measure being referenced. As of this blog post you cannot edit a field parameter through the GUI; it must be changed within the DAX generated.
Use case examples
Swapping between different breakdowns
A great use case for field parameters is giving the user the ability to swap between different breakdowns for a metric on a single visual. This is a great space saver as previously we would need a separate visual for each category split. In the example below we have setup a field parameter with a list of different attributes for a sales dataset; for example a product brand, type of shipping for a sale, and where a sale took place. In the first screen shot we have selected Channel Source as our attribute. The bar chart is displaying this attribute on the axis with the relevant chart title.

When we change from Channel Source to Shipping Service Vendor the chart updates with the new attribute on the axis and an updated chart title. We are able to navigate through any of these options on the same graph.

Swapping between different metrics
We can also setup field parameters to swap between different metric / KPIs in exactly the same way as the previous example. This allows us to look at different metrics for a particular breakdown.

The great thing about this method is when we swap over a metric the formatting of the metric also changes. Here we swapped from currency to percentage and the visual updated accordingly.

It is possible to take this one step further and use two different field parameters to control changing both the breakdown and the metric on the same visual.
Slice and dice tables
If we create a field parameter which combines dimensional attributes and metrics in conjunction with a table or matrix visual we can create a slice and dice table. A slice and dice table gives the user endless possibilities of analysing and aggregating their data.
Below we have setup a field parameter slicer with a number of different KPI’s and attributes. In the first example we have selected to evaluate order line # by channel source. The table has updated to give us a breakdown of these values.
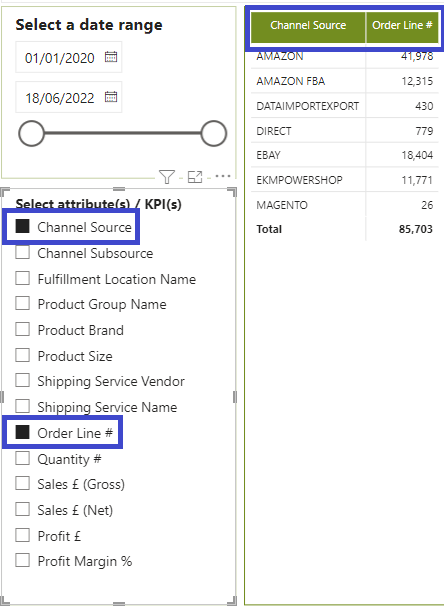
If we select a few more measures they are added onto the table with the current breakdown and with the correct number formatting.
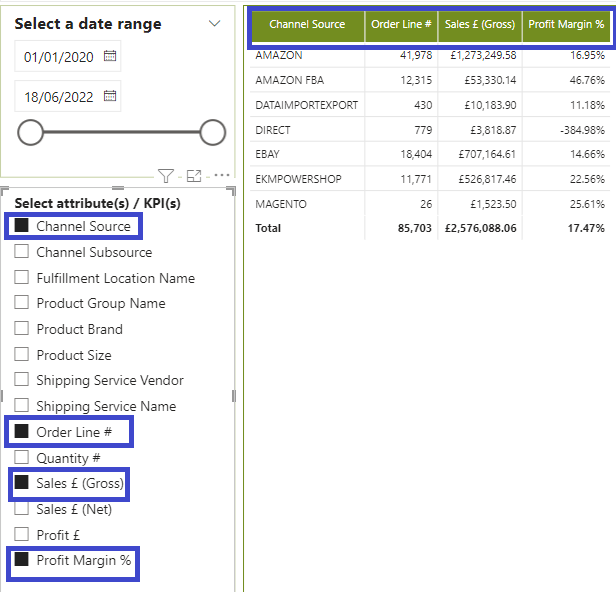
Need to updated the breakdown? Select an additional attribute and the table will update to reflect the metric values by this new breakdown. Now we can see Order line #, Sales gross, and profit margin by both Channel Source and Channel Subsource.
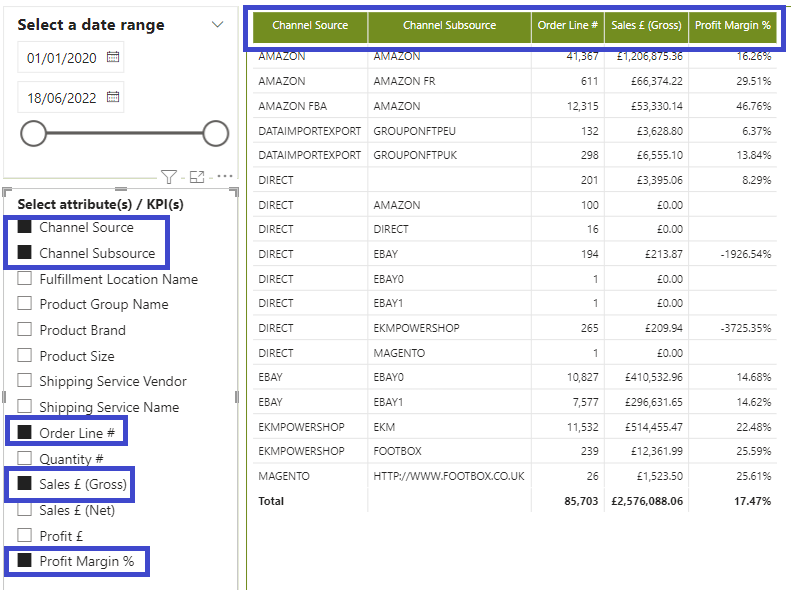
The table will input the values based upon the order they are selected in the fields parameter slicer. This is great as it gives you the ability to explicitly order the columns within the table.
As you can hopefully see from the above examples field parameters is an incredibly powerful new feature in Power BI and I look forward to the future tweaks Microsoft makes and for the feature becoming generally available!