Date and time tables are commonly found in data models. This includes data warehouse models and models created in BI visualisation tools such as Power BI (PBI). A typical business requirement is to analyse data over a period of time. These tables provide the foundation to do this.
In this article I will show how we can create your own tables within the Microsoft Products SQL Server and PBI. The main focus will be on Date tables but we will create a Time table within SQL Server.
Date and Time Tables in SQL Server
In data warehouses we are typically collecting data over a period of time. Nearly all fact tables will have a date; a sales date, shipping date, attendance date, event date as examples. Setting bespoke tables to define dates and times allow for easy slicing and dicing of our metrics. It also means developers and analysts do not need to perform common date calculations on the fly. It also provides a framework for people to talk about dates in the same way. Typical analytics involving dates include:
- Grouping data by day, week, month, quarter or year;
- Grouping data by day of the week;
- Grouping data by weekdays and weekends;
- Comparing periods of time; for example current month vs previous month, or current week vs previous week;
- Show dates and their attributes by different formatting. For example using an attributes full name or it’s short name – July vs Jul or Monday vs Mon;
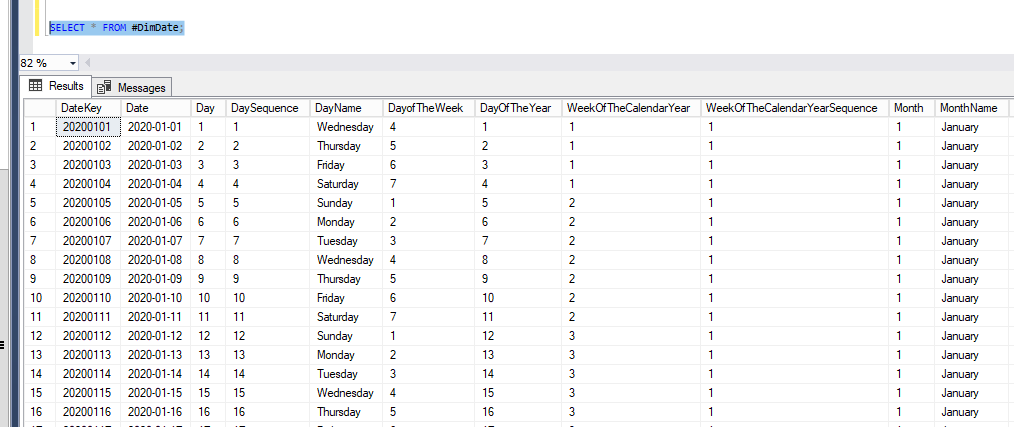
The below SQL statement will create a date table into a temporary table with columns that can help us perform these tasks. Modifying the variables @dimDateStart and @dimDateEnd will change the range of the dates.
-- Define the start and end dates for our date table
DECLARE @dimDateStart AS date = '20200101';
DECLARE @dimDateEnd AS date = '20201231';


IF OBJECT_ID('tempdb..#DimDate') IS NOT NULL
	DROP TABLE #DimDate;

CREATE TABLE #DimDate (

	[DateKey]						int				NOT NULL,
	[Date]							date			NOT NULL,
	[Day]							smallint		NULL,
	[DaySequence]					int				NULL,
	[DayName]						varchar(9)		NULL,
	[DayofTheWeek]					smallint		NULL,
	[DayOfTheYear]					int				NULL,
	[WeekOfTheCalendarYear]			smallint		NULL,
	[WeekOfTheCalendarYearSequence]	int				NULL,
	[Month]							smallint		NULL,
	[MonthName]						varchar(9)		NULL,
	[MonthSequence]					int				NULL,
	[Year]							smallint		NULL,
	[YearSequence]					int				NULL,
	[IsLeapYear]					tinyint			NULL,
	[Quarter]						smallint		NULL,
	[QuarterName]					varchar(6)		NULL,
	[IsWeekDay]						tinyint			NULL,
	[IsWeekend]						tinyint			NULL,
	[StartOfWeek]					date			NULL,
	[EndOfWeek]						date			NULL,
	[StartOfMonth]					date			NULL,
	[EndOfMonth]					date			NULL,
	[StartofQuarter]				date			NULL,
	[EndOfQuarter]					date			NULL,
	[StartOfYear]					date			NULL,
	[EndOfYear]						date			NULL

);


WITH seq(n) AS (

	SELECT	0
	UNION ALL SELECT n + 1 FROM seq
	WHERE n < DATEDIFF(DAY, @dimDateStart, @dimDateEnd)

)

,d(d) AS
(

  SELECT DATEADD(DAY, n, @dimDateStart) FROM seq

)


INSERT INTO #DimDate (

	[DateKey],
	[Date],
	[Day],
	[DaySequence],
	[DayName],
	[DayofTheWeek],
	[DayOfTheYear],
	[WeekOfTheCalendarYear],
	[WeekOfTheCalendarYearSequence],
	[Month],
	[MonthName],
	[MonthSequence],
	[Year],
	[YearSequence],
	[IsLeapYear],
	[Quarter],
	[QuarterName],
	[IsWeekDay],
	[IsWeekend],
	[StartOfWeek],
	[EndOfWeek],
	[StartOfMonth],
	[EndOfMonth],
	[StartofQuarter],
	[EndOfQuarter],
	[StartOfYear],
	[EndOfYear]

)

SELECT

    Year(d.d) * 10000 + Month(d.d) * 100 + Day(d.d) AS [DateKey],
	d.d AS [Date],
	DAY(d.d) AS [Day],
	ROW_NUMBER() OVER (ORDER BY d.d) AS DaySequence,
    [DayName] = DATENAME(WEEKDAY, d),
	DATEPART(WEEKDAY, d) AS DayOfTheWeek,
	DATEPART(DAYOFYEAR, d) AS DayOfTheYear,
    [WeekOfTheCalendarYear]  = DATEPART(WEEK, d),
	DENSE_RANK() OVER (ORDER BY YEAR(d.d), MONTH(d.d)) AS WeekOfTheCalendarYearSequence,

	MONTH(d.d) AS [Month],
	[MonthName] = DATENAME(MONTH, d),
	DENSE_RANK() OVER (ORDER BY YEAR(d.d), MONTH(d.d)) AS MonthSequence,
	YEAR(d.d) AS [Year],
	DENSE_RANK() OVER (ORDER BY YEAR(d.d)) AS YearSequence,

	CASE
		WHEN (YEAR(d.d) % 400 = 0) OR (YEAR(d.d) % 4 = 0 AND YEAR(d.d) % 100 <> 0) THEN 1
		ELSE 0
	END AS IsLeapYear,

	[Quarter] = DATEPART(Quarter, d),
	[QuarterName] = 'Q' + CAST(DATEPART(Quarter, d) AS varchar(5)),
	CASE
		WHEN DATENAME(WEEKDAY, d) IN ('Saturday', 'Sunday') THEN 0
		ELSE 1
	END AS [IsWeekDay],
	CASE
		WHEN DATENAME(WEEKDAY, d) IN ('Saturday', 'Sunday') THEN 1
		ELSE 0
	END AS [IsWeekend],

	DATEADD(DAY, 2 - DATEPART(WEEKDAY, d.d), CAST(d.d AS DATE)) AS [StartOfWeek],
	DATEADD(DAY, 8 - DATEPART(WEEKDAY, d.d), CAST(d.d AS DATE)) AS [EndOfWeek],
	DATEADD(MONTH, DATEDIFF(MONTH, 0, d.d), 0) AS [StartOfMonth],
	DATEADD(dd, -(DAY(DATEADD(mm,1,d.d))), DATEADD(mm,1,d.d)) AS [EndOfMonth],
	DATEADD(qq, DATEDIFF(qq, 0, d.d), 0) AS [StartOfQuarter],
	DATEADD (dd, -1, DATEADD(qq, DATEDIFF(qq, 0, d.d) +1, 0)) AS [EndOfQuarter],
	CAST(CAST(YEAR(d.d) AS varchar(4)) + '0101' AS date) AS [StartOfYear],
	CAST(CAST(YEAR(d.d) AS varchar(4)) + '1231' AS date) AS [EndOfYear]

FROM

	d OPTION (MAXRECURSION 0);
The same principles apply when we look at time. Typical analytics involving times include:
- Grouping data by hour;
- Grouping data by your organisations working hours and non-working hours;
- Grouping data for periods of the day; AM vs PM for example;
- Showing times with either a 12 hour or 24 hour clock.
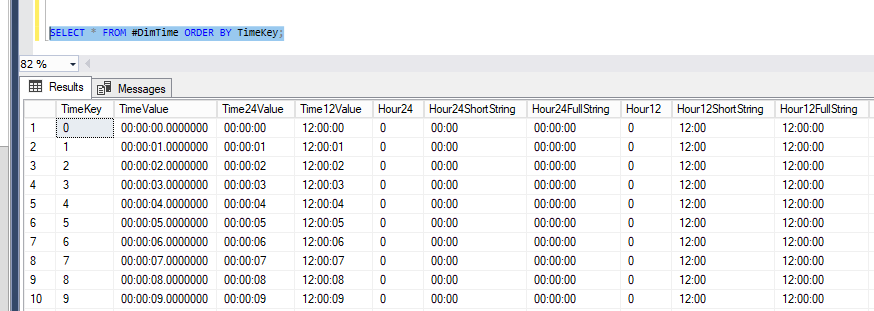
The below SQL statement will create a time table into a temporary table. The table granularity will be one row per second in the day.
DECLARE	@dimTimeStartTime		AS time = '00:00:00';
DECLARE @dimTimeInterval		AS int = 1;
DECLARE @dimTimecount			AS int = (60 * 60 * 24);

IF OBJECT_ID('tempdb..#DimTime') IS NOT NULL
	DROP TABLE #DimTime;

CREATE TABLE #DimTime (

	TimeKey						int								NOT NULL,
	TimeValue					time							NOT NULL,
	Time24Value					varchar(8)						NOT NULL,
	Time12Value					varchar(8)						NOT NULL,
	Hour24						int								NOT NULL,
	Hour24ShortString			varchar(5)						NOT NULL,
	Hour24FullString			varchar(8)						NOT NULL,
	Hour12						int								NOT NULL,
	Hour12ShortString			varchar(5)						NOT NULL,
	Hour12FullString			varchar(8)						NOT NULL,
	HourSequence				int								NOT NULL,
	Minute						int								NOT NULL,
	MinuteSequence				int								NOT NULL,
	Second						int								NOT NULL,
	SecondSequence				int								NOT NULL,
	HalfHour					int								NOT NULL,
	HalfHour24ShortString		varchar(5)						NOT NULL,
	HalfHour24LongString		varchar(8)						NOT NULL,
	HalfHour12ShortString		varchar(5)						NOT NULL,
	HalfHour12LongString		varchar(9)						NOT NULL,
	HalfHourSequence			int								NOT NULL,
	QuarterHour					int								NOT NULL,
	QuarterHour24ShortString	varchar(5)						NOT NULL,
	QuarterHour24LongString		varchar(8)						NOT NULL,
	QuarterHour12ShortString	varchar(5)						NOT NULL,
	QuarterHour12LongString		varchar(8)						NOT NULL,
	QuarterHourSequence			int								NOT NULL,
	AMPM						varchar(2)						NOT NULL,
	isCoreWorkHours				tinyint							NOT NULL,
	TimeSequence				int								NOT NULL

);

WITH cSequence AS (

    SELECT

	   1 AS RowOrder,
       @dimTimeStartTime AS RowTime

    UNION ALL

    SELECT

	  RowOrder + 1 AS RowOrder,
      DATEADD(SECOND, @dimTimeInterval, RowTime) AS StartRange

    FROM

		cSequence

    WHERE

		RowOrder < @dimTimecount
)

INSERT INTO #DimTime (

	TimeKey,
	TimeValue,
	Time24Value,
	Time12Value,
	Hour24,
	Hour24ShortString,
	Hour24FullString,
	Hour12,
	Hour12ShortString,
	Hour12FullString,
	HourSequence,
	Minute,
	MinuteSequence,
	Second,
	SecondSequence,
	HalfHour,
	HalfHour24ShortString,
	HalfHour24LongString,
	HalfHour12ShortString,
	HalfHour12LongString,
	HalfHourSequence,
	QuarterHour,
	QuarterHour24ShortString,
	QuarterHour24LongString,
	QuarterHour12ShortString,
	QuarterHour12LongString,
	QuarterHourSequence,
	AMPM,
	isCoreWorkHours,
	TimeSequence

)

SELECT

	(DATEPART(HOUR, RowTime) * 10000) + (DATEPART(MINUTE, RowTime) * 100) + DATEPART(SECOND, RowTime) AS TimeKey,
	RowTime AS TimeValue,
	RIGHT(CONVERT(NVARCHAR, RowTime, 120) ,8) AS Time24Value,
	REPLACE(CASE
		WHEN LEN(DATEPART(HOUR, RowTime) % 12) = 1 THEN '0' + CAST(DATEPART(HOUR, RowTime) % 12 AS varchar(1))
		ELSE CAST(DATEPART(HOUR, RowTime) % 12 AS varchar(2))
	END, '00', '12') +
	RIGHT(CONVERT(NVARCHAR, RowTime, 120) ,6) AS Time12Value,
	DATEPART(HOUR, RowTime) AS Hour24,
	RIGHT('0'+ CONVERT(varchar(2), DATEPART(HOUR, RowTime)),2)+ ':00' Hour24ShortString,
	RIGHT('0' + CONVERT(varchar(2) ,DATEPART(HOUR, RowTime)), 2) + ':00:00' Hour24FullString,
	DATEPART(HOUR, RowTime) % 12 AS Hour12,
	REPLACE(RIGHT('0'+ CONVERT(varchar(2), DATEPART(HOUR, RowTime)%12),2)+ ':00', '00:00', '12:00') Hour12ShortString,
	REPLACE(RIGHT('0' + CONVERT(varchar(2) ,DATEPART(HOUR, RowTime)%12), 2) + ':00:00', '00:00:00', '12:00:00') Hour12FullString,
	DENSE_RANK() OVER (ORDER BY DATEPART(HOUR, RowTime)) AS HourSequence,
	DATEPART(MINUTE, RowTime) AS Minute,
	DENSE_RANK() OVER (ORDER BY DATEPART(HOUR, RowTime), DATEPART(MINUTE, RowTime)) AS MinuteSequence,
	DATEPART(SECOND, RowTime) AS Second,
	ROW_NUMBER() OVER (ORDER BY DATEPART(HOUR, RowTime),  DATEPART(MINUTE, RowTime), DATEPART(SECOND, RowTime)) AS SecondSequence,
	((DATEPART(MINUTE, RowTime) / 30) + 1) * 30 AS HalfHour,
	RIGHT('0' + CONVERT(varchar(2), DATEPART(HOUR, RowTime)),2) + ':' +
	RIGHT('0' + CONVERT(varchar(2),((DATEPART(MINUTE, RowTime)/30)*30)),2) AS HalfHour24ShortString,
	RIGHT('0' + CONVERT(varchar(2), DATEPART(HOUR, RowTime)),2) + ':' +
	RIGHT('0' + CONVERT(varchar(2),((DATEPART(MINUTE, RowTime)/30)*30)),2) + ':00' AS HalfHour24LongString,
	REPLACE(RIGHT('0' + CONVERT(varchar(2), DATEPART(HOUR, RowTime) % 12),2) + ':' +
	RIGHT('0' + CONVERT(varchar(2),((DATEPART(MINUTE, RowTime)/30)*30)),2), '00:', '12:') AS HalfHour12ShortString,
	REPLACE(RIGHT('0' + CONVERT(varchar(2), DATEPART(HOUR, RowTime) % 12),2), '00', '12') + ':' +
	RIGHT('0' + CONVERT(varchar(2),((DATEPART(MINUTE, RowTime)/30)*30)),2) + ':00' AS HalfHour12LongString,
	DENSE_RANK() OVER (ORDER BY DATEPART(HOUR, RowTime), DATEPART(MINUTE, RowTime) / 30) AS HalfHourSequence,
	((DATEPART(MINUTE, RowTime) / 15) + 1) * 15 AS QuarterHour,
	REPLACE(RIGHT('0' + CONVERT(varchar(2), DATEPART(HOUR, RowTime)),2) + ':' +
	RIGHT('0' + CONVERT(varchar(2), ((DATEPART(MINUTE, RowTime)/15)*15)),2), '00:', '12:') AS QuarterHour24ShortString,
	REPLACE(RIGHT('0' + CONVERT(varchar(2), DATEPART(HOUR, RowTime)),2), '00', '12') + ':' +
	RIGHT('0' + CONVERT(varchar(2), ((DATEPART(MINUTE, RowTime)/15)*15)),2) + ':00' AS QuarterHour24LongString,
	RIGHT('0' + CONVERT(varchar(2), DATEPART(HOUR, RowTime) % 12),2) + ':' +
	RIGHT('0' + CONVERT(varchar(2),((DATEPART(MINUTE, RowTime)/30)*30)),2) AS QuarterHour12ShortString,
	RIGHT('0' + CONVERT(varchar(2), DATEPART(HOUR, RowTime) % 12),2) + ':' +
	RIGHT('0' + CONVERT(varchar(2),((DATEPART(MINUTE, RowTime)/30)*30)),2) + ':00' AS QuarterHour12LongString,
	DENSE_RANK() OVER (ORDER BY DATEPART(HOUR, RowTime), DATEPART(MINUTE, RowTime) / 15) AS QuarterHourSequence,
	CASE
		WHEN RowTime < '12:00:00.000' THEN 'AM'
		ELSE 'PM'
	END AS AMPM,
	CASE
		WHEN RowTime BETWEEN '09:00:00.000' AND '17:00:00.000' THEN 1
		ELSE 0
	END AS isCoreWorkHours,
	ROW_NUMBER() OVER (ORDER BY RowOrder) AS TimeSequence

FROM

	cSequence

WHERE

	RowOrder <= 86400

ORDER BY

	RowOrder

OPTION (MAXRECURSION 0);
Date Tables in Power BI (PBI)
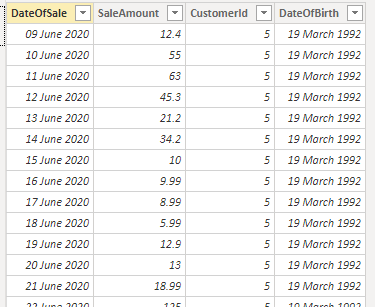
To demonstrate date tables and time intelligence in PBI we will start with a simple model containing one table called Dummy Data. This table is made up of Sales data and contains 4 columns and 520 rows of data:
- DateOfSale. Date column specifying the sale date.
- SaleAmount. Decimal column specifying the cost of sale.
- CusomterId. Integer column specifying the id of the customer who transacted the sale.
- DateOfBirth. Date column specifying the date of birth of the customer.
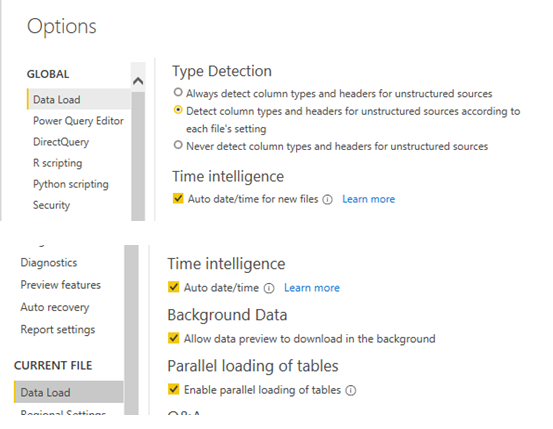
Date tables are incredibly powerful tool in PBI as they allow us to perform time intelligence calculations. They are so powerful that, by default, PBI creates hidden date tables for each date field we have populated in our model. These hidden date tables are controlled by the Time Intelligence options in Power BI Desktop found in the Data Load options for GLOBAL and CURRENT FILE.
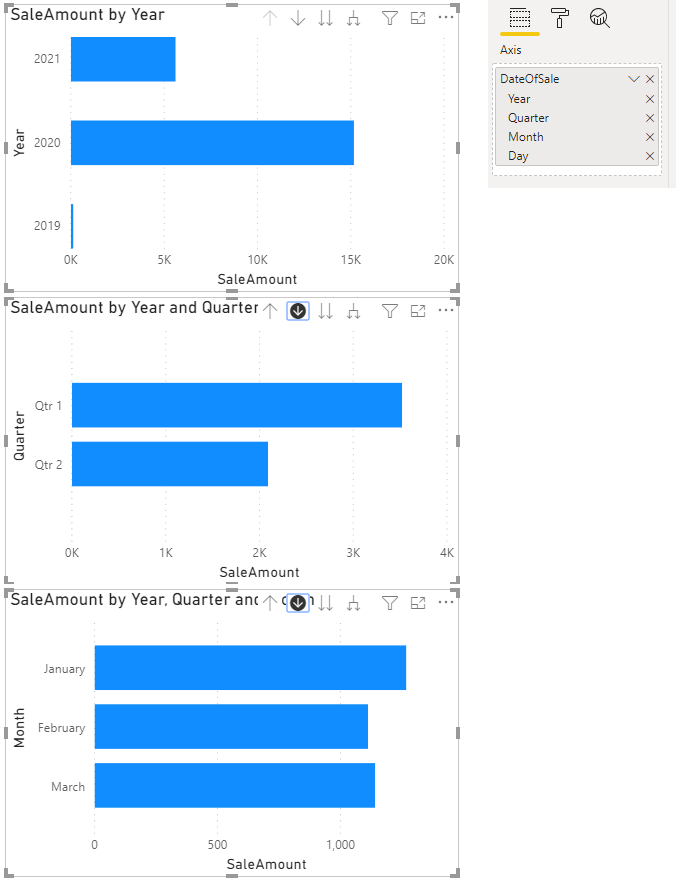
The hidden date table allows us to perform basic time intelligence analysis. If we create a simple bar chart visual using the DateOfSale as our axis and SaleAmount as our values, PBI will automatically create a date hierarchy of Year, Quarter, Month, and Day which we can drill down within the visual. This enhances the user experience as they can easily navigate through the different aggregation levels by clicking on an individual bar.
Unfortunately hidden date tables can lead to bloated data models. To analysis this we can load our model into DAX Studio. DAX Studio is a very useful tool as it allows us to see the size of our model broken down by each individual table. This shows us there are two hidden date tables; one for the DateOfSales column and one for the DateOfBirth column plus our original table.

The first date table, which relates to the DateOfBirth column is taking up 91.4% of our model size. Our actual data contained in the Dummy Data table is only 1.5% of the model! If we look at the dates contained in the DateOfBirth column there are only 5 values:
- 01/01/1936
- 01/01/1990
- 23/05/1974
- 25/01/1982
- 19/03/1992
However the range of dates is very wide starting in 1936 and going to 1992. There are 20, 532 days between these two dates. The hidden date table will be based upon this range of values, populating a row for each date between them. The cardinality of the hidden date table is slightly more as it will go from the start of the year of the earliest date and the end of the year of the latest date.
Having a date table for DateOfBirth is not very useful and is bloating our model size. Fortunately PBI gives us the option of specifying our own date table. There are a number of different ways we could derive the table:
- Import a Date table from an external source such as a data warehouse, like the one we created earlier in the article;
- Create the date table in DAX;
- Create the date table in M.
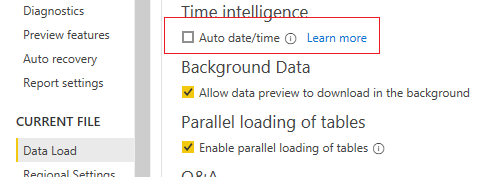
We will concentrate on creating the date table using DAX in the rest of this article. Before we create our own date table let’s turn off the auto time intelligence functions of Power BI Desktop.
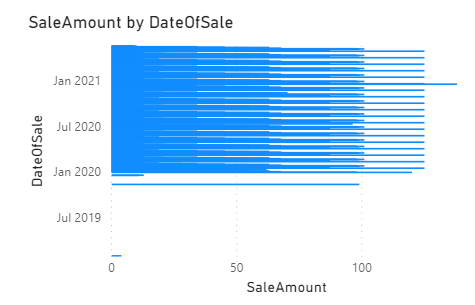
Until we populate our own date table we lose the ability of doing date hierarchies as we had before. The visual we created earlier now changes to just show SalesAmount by each SalesDate without the ability to aggregate through the different hierarchical periods.
If we reload our model into DAX Studio we can see that the hidden date tables are gone.

The size of our model has decreased from 2.07mb to 31.85kb; a reduction of ~ 98%!
Before.

After.

Date Table in DAX
DAX provides us with two functions which can be used to create our own date tables; CALENDARAUTO and CALENDAR. The CALENDARAUTO function will return a table with a single column named Date that contains a contiguous set of dates. The set of dates returned will be determined automatically based upon our model. We will start with this function.
We can create the table by selecting the New Table within Power BI desktop under the Table Tools data in the Data section and writing the relevant DAX code.

CALENDARAUTO TABLE = CALENDARAUTO( )
The function has generated a list of dates starting from 01/01/1936 going to 31/12/2021.

DAX Studio confirms the cardinality to be 31, 412.

So how did it derive this specific list of dates? In the Dummy Data table we have two date columns. DatofBirth which has a minimum recorded date of 01/01/1936 and a maximum recorded date of 19/03/1992. DateOfSale which has a minimum recorded date of 01/02/2019 and a maximum recorded date of 22/05/2021. The DAX function has taken the minimum and maximum dates from both of these columns, extrapolated to the start and end years of each range and created the date list. This is not particularly useful as we are only interested in doing time intelligence analysis againdt the DateOfSale column which has a much smaller range of dates.
CALENDAR
The CALENDAR function in DAX works slightly different to the CALENDARAUTO function. It allows us to specify the range of dates we want to use. We have the ability to work out this range based upon data in other tables. Let’s create a new table using this function. We will take the minimum and maximum dates from the DateOfSale column to work out our range.
CALENDAR TABLE =
CALENDAR ( MIN ( 'Dummy Data'[DateOfSale] ), MAX ( 'Dummy Data'[DateOfSale] ) )
This returns a continuous set of dates between 01/02/2019 and 22/05/2021.

This date table in comparison to the calendarauto date table is much smaller in size which makes our model more efficient.

Adding additional columns
We can add additional columns individually using the New Column button under the Column Tools tab within Power BI.

To add three new columns to show the month number, the short name of the month and the full name of the month we use the three statements.
MonthNum = MONTH ( 'CALENDAR TABLE'[Date] )

MonthNameShort = FORMAT ( 'CALENDAR TABLE'[Date], "mmm" )

MonthNameLong = FORMAT ( 'CALENDAR TABLE'[Date], "mmmm" )
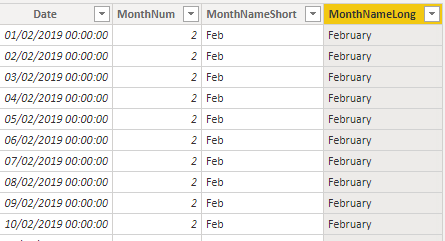
If we wanted to add lots of columns to our date table then this process would be very labour intensive. Instead it would be better to write one DAX statement to populate the date table. This allows us to reuse the same bit of code in our other models. We can do this with the following steps:
- We use GENERATE and ROW DAX functions to add additional columns to our table expression;
- We create a date table using the CALENDAR function taking the minimum and maximum date values in DateOfSales for our date range;
- We return one row at a time, iterating through each Date in our date table and calculate the result of each additional column we want.
Below is the DAX to create the date table with the three additional columns for the month number, the short name of the month and the full name of the month.
CALENDAR TABLE =
VAR StartDate =
    MIN ( 'Dummy Data'[DateOfSale] )
VAR EndDate =
    MAX ( 'Dummy Data'[DateOfSale] )
VAR Cal =
    CALENDAR ( StartDate, EndDate )
RETURN
    GENERATE (
        Cal,
        VAR RowDate = [Date]
        RETURN
            ROW (
                "MonthNum", MONTH ( RowDate ),
                "MonthNameShort", FORMAT ( [Date], "mmm" ),
                "MonthNameLong", FORMAT ( [Date], "mmmm" )
            )
    )
We can flesh the DAX code out to add in additional useful columns:
CALENDAR TABLE =
VAR StartDate =
    MIN ( 'Dummy Data'[DateOfSale] )
VAR EndDate =
    MAX ( 'Dummy Data'[DateOfSale] )
VAR Cal =
    CALENDAR ( StartDate, EndDate )
RETURN
    GENERATE (
        Cal,
        VAR RowDate = [Date]
        RETURN
            ROW (

                "Day", DAY ( RowDate ),
                "DaySequence", DATEDIFF ( StartDate, RowDate, DAY ) + 1,
                "DayName", FORMAT ( RowDate, "dddd"),
                "DayNameShort", FORMAT ( RowDate, "ddd" ),
                "DayOfTheWeek", WEEKDAY ( RowDate, 2 ), -- we want to start the day on Monday, not Sunday!
                "DayOfTheYear", DATEDIFF ( DATE ( YEAR ( RowDate ), 1, 1 ), RowDate , DAY ) + 1,
                "WeekOfTheCalendarYear", WEEKNUM ( RowDate, 2 ), -- we want to start the day on Monday, not Sunday!
                "Month", MONTH ( RowDate ),
                "MonthName", FORMAT ( RowDate, "mmmm" ),
                "MonthNameShort", FORMAT ( RowDate, "mmm" ),
                "MonthSequence", DATEDIFF ( StartDate, RowDate, MONTH ) + 1,
                "Year", YEAR ( RowDate ),
                "YearSequence", DATEDIFF ( StartDate, RowDate, YEAR ) + 1,
                "Quarter", QUARTER( RowDate ),
                "QuarterName", CONCATENATE( "Q", QUARTER ( RowDate )),
                "QuarterSequence", DATEDIFF ( StartDate, RowDate, QUARTER ) + 1,
                "IsWeekDay", IF (WEEKDAY ( RowDate, 2) IN { 6, 7 }, 0, 1 )

            )
    )

If we take a look at the updated date table in DAX studio it first appears the table size is over 5mb; bigger than our previous attempts!


It turns out the initial refresh will show that 1MB of RAM has been allocated for the dictionary size regardless of the actual size of the columns. To fix this, save the PBI file, close the file, open it again and rerun DAX Studio and VertiPaq analyser. This time we get the correct values and can see this date table is smaller than our previous attempts:


Setting up the model
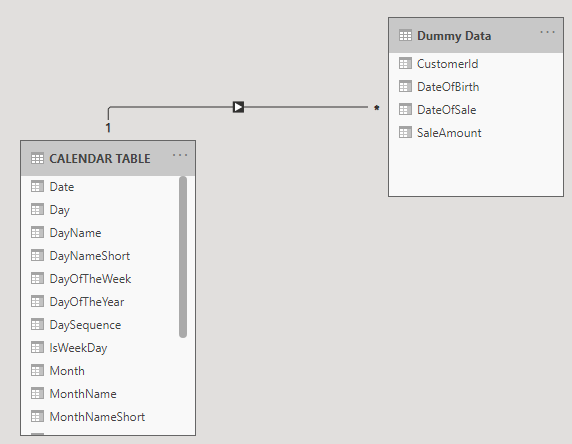
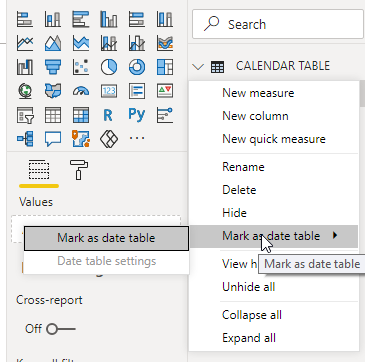
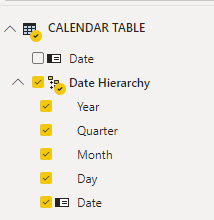
Now we have our date table we can finish by setting it up in the model. We do this by creating a relationship between the date table and our original table, marking the date table so PBI knows it is a date table and setting up a new date hierarchy.
Final Thoughts
Date time tables are powerful constructs in data analysis and have a use in nearly all scenarios. When using PBI creating your own date table can decrease the size of your model and improve time intelligence usability. This can be done easily with DAX using a statement that can readily reused in all your models.